From this month, the Climate Intelligence Brief shifts its primary focus from tracking the development of El Niño to monitoring for early signs of its potential impacts across the Garden Route.
El Niño is now well established and will continue to be monitored. The more important question now is whether the forecast climate hazard is beginning to translate into changes in rainfall, water availability, soil moisture, heat and environmental drying.
The objective of these briefs will be simple: identify any deterioration in the environment early enough so that preparedness actions can be stepped up before significant impacts emerge.
This approach is consistent with guidance issued by SAWS and the National Disaster Management Centre this afternoon (21 September). While the developing El Niño is exceptional, SAWS cautions that its magnitude should not be interpreted as a direct indication of the magnitude or location of impacts. The NDMC emphasises that preparedness should begin before impacts materialise, with local risk assessments guiding decisions.
That is the purpose of the monitoring framework used in this brief.
El Niño Status

The latest data shows this event is still strengthening and is expected to peak in November. It is still in record-breaking territory.
The Headline
For the indicators we have chosen to monitor for early impact signs in the Garden Route, here are the current high-level findings:
- Rainfall & drought development - Normal
- Water security - Normal
- Soil & vegetation - Normal
- Heat & evaporation - No sustained stress
- Forward risk - Elevated
Current conditions remain favourable. The warning signal lies ahead, not in present impacts.
Rainfall & drought development
For this signal we use the ARC Drought Monitor and the latest South African Weather Service rainfall data for the month.
First up here is the current rainfall data for the first 20 days of September from the SAWS:
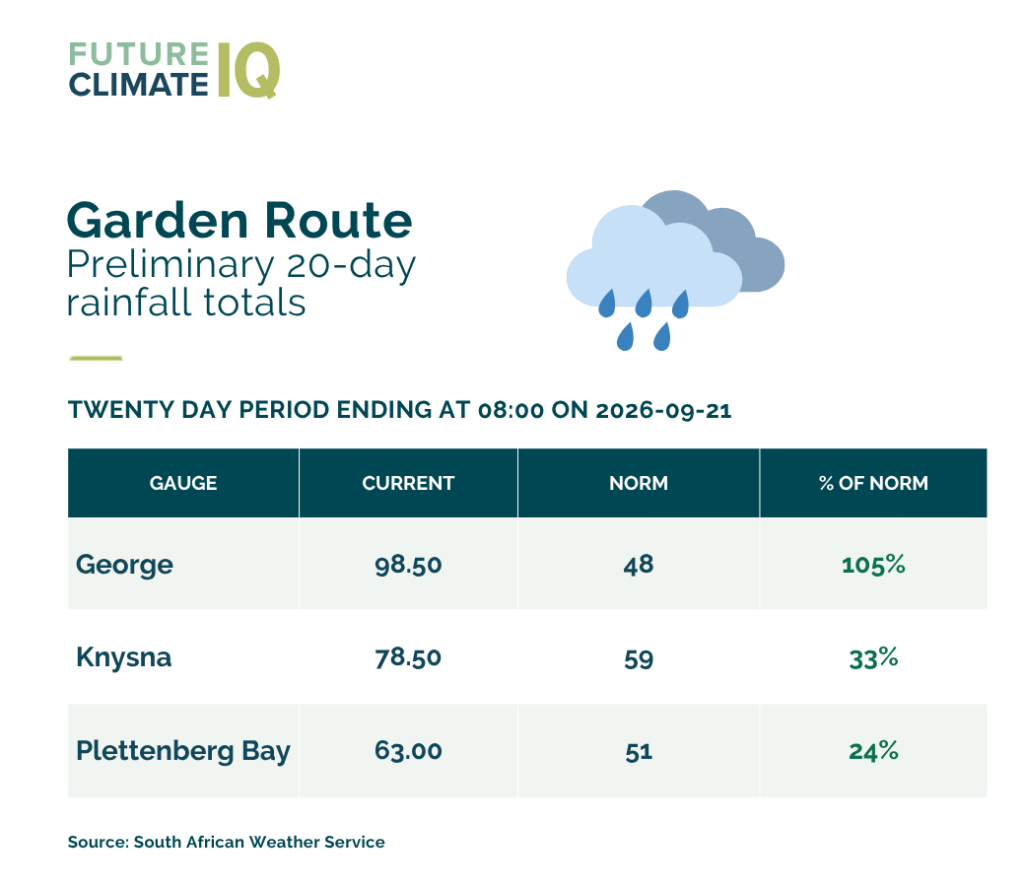
As you can see across the Garden Route region rainfall in September is above normal with 10 days of the month remaining, and in the case of George, by a considerable amount. From this there is no signal of decreasing rainfall.
Next we would like to answer the question: Has rainfall over the last three and six months become unusually dry relative to its historical record. For this we will use the ARC data specifically what is known as the 3-Month and 6-Month Standardized Precipitation Index. (SPI-3 & SPI-6)
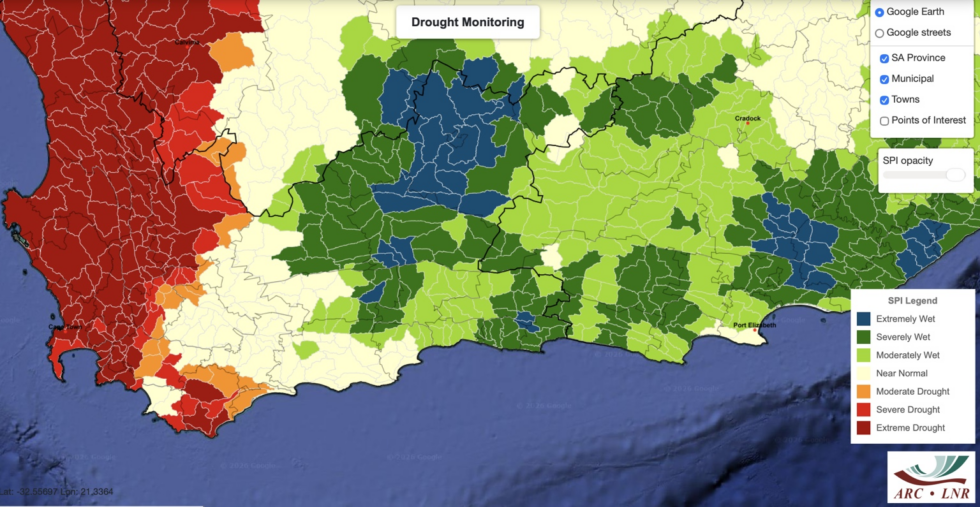

SPI-3 our early drought indicator (left map), shows predominantly wet conditions across the George–Plettenberg Bay corridor. There is currently no short-term meteorological drought signal.
Of interest is the very different signal already visible further west. Across much of the western half of the Western Cape, including Cape Town and parts of the Overberg, SPI-3 has shifted into drought categories, with areas of severe and extreme drought evident. This signal is not currently present across the Garden Route, but it illustrates how quickly accumulated rainfall conditions can shift across the province and why we will track SPI-3 closely over the coming months.
SPI-6 which reflects longer-term persistence (right map), shows an even stronger wet signal, with much of the region classified as extremely wet. The Garden Route is therefore entering the higher-risk summer period with a substantial accumulated rainfall buffer.
With these maps we are going to be tracking whether the following sequence unfolds:
Extremely/severely wet → moderately wet → near normal → moderate dry → severe drought
Water security
Here are the latest dam levels for the Garden Route District as supplied by the Department of Water and Sanitation and in the case of the Akkerkloof storage dam, the Knysna Municipality.
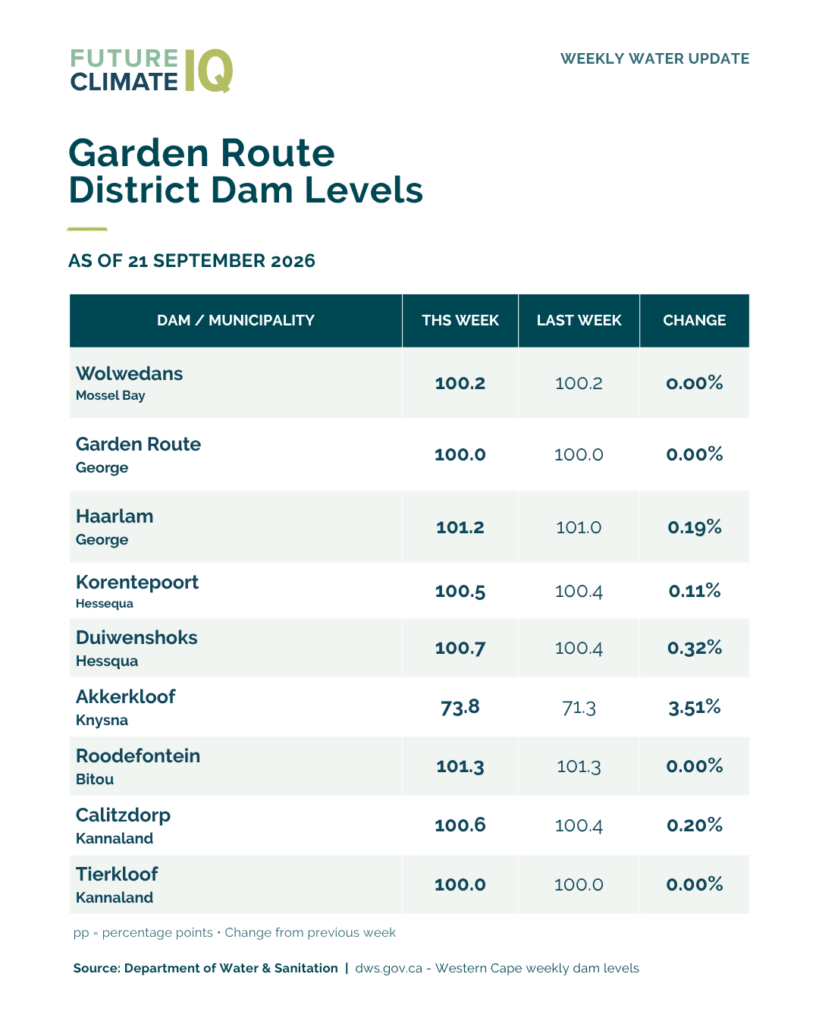
At this stage it is clear that the region's dams are in good condition as we enter spring. The exception is the Akkerkloof dam in Knysna. This dam is not river-fed but is filled by pumping water from the Knysna River. It is not monitored with gauges by DWS and we are reliant on data from the Knysna municipality. At the moment approximately 1 ML/day is being pumped into Akkerkloof from the Knysna River. Continued favourable river extraction conditions would allow further recovery in storage before summer.
Below is the latest Knysna River Risk Monitor data. (The reason we track this river specifically is because this is the towns main water source)
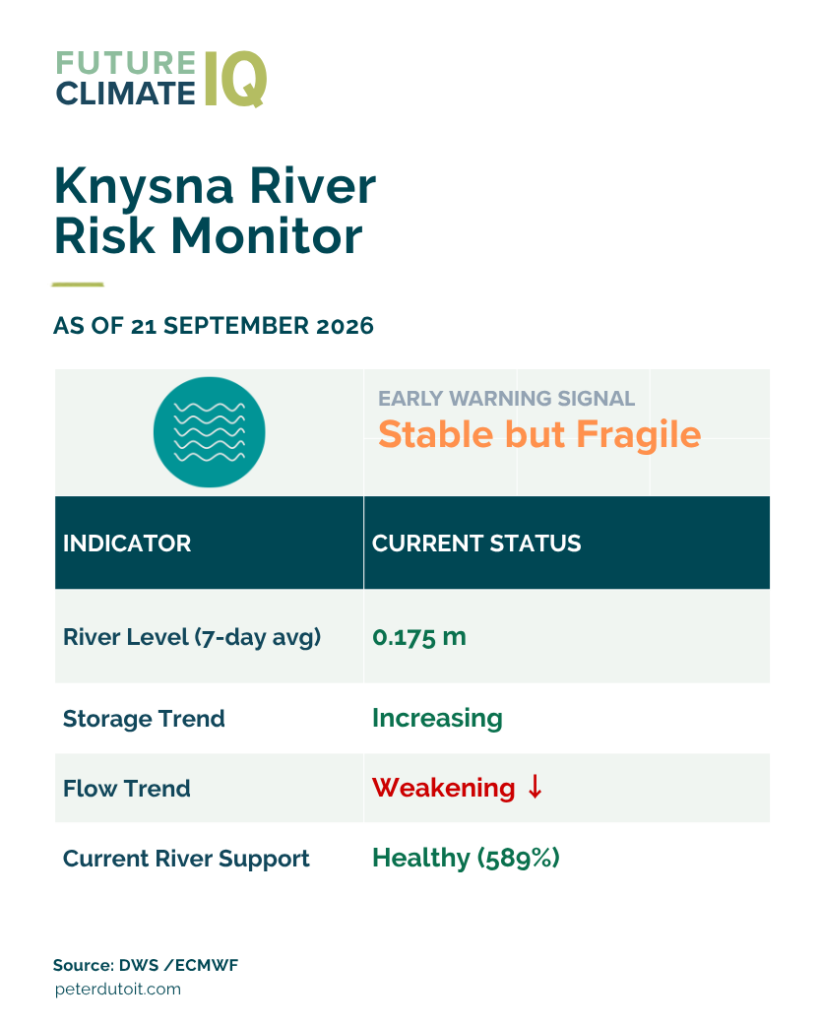
Although river conditions are currently healthy for extraction at the Charlesford extraction site, the flow trend is weakening after recent rains which is why the current river status is Stable but Fragile.
Soil moisture
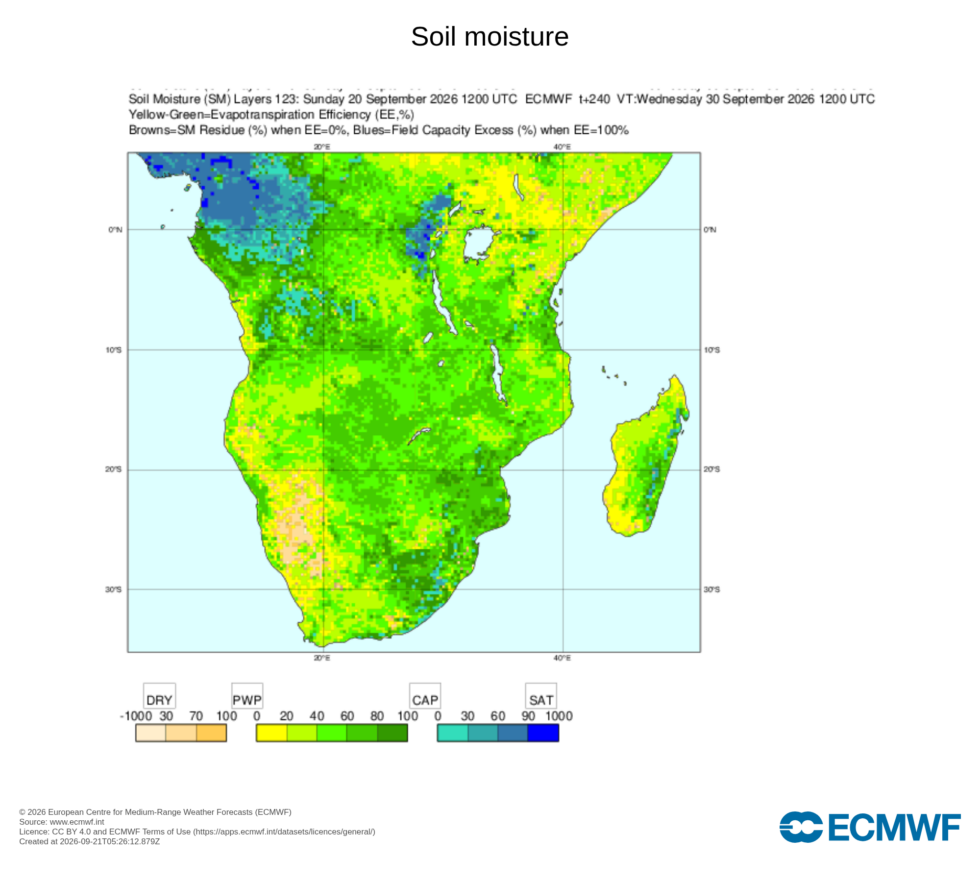
Soil moisture provides an early signal of changing water availability for vegetation. Progressive drying over time contributes to vegetation stress and, alongside weather and fuel conditions, has an influence on fire risk.
The ECMWF soil-moisture forecast through 30 September does not currently indicate widespread soil-moisture stress across the Garden Route. This is consistent with the wet conditions shown by SPI-3 and SPI-6.
Heat and atmospheric drying
We monitor three indicators using AgERA5: maximum temperature (Tmax), vapour pressure deficit (VPD), which indicates atmospheric drying demand, and reference evapotranspiration (ET₀), which indicates potential moisture loss under the prevailing weather conditions. Each is compared with the corresponding 1991–2020 historical period to determine how unusual current conditions are.
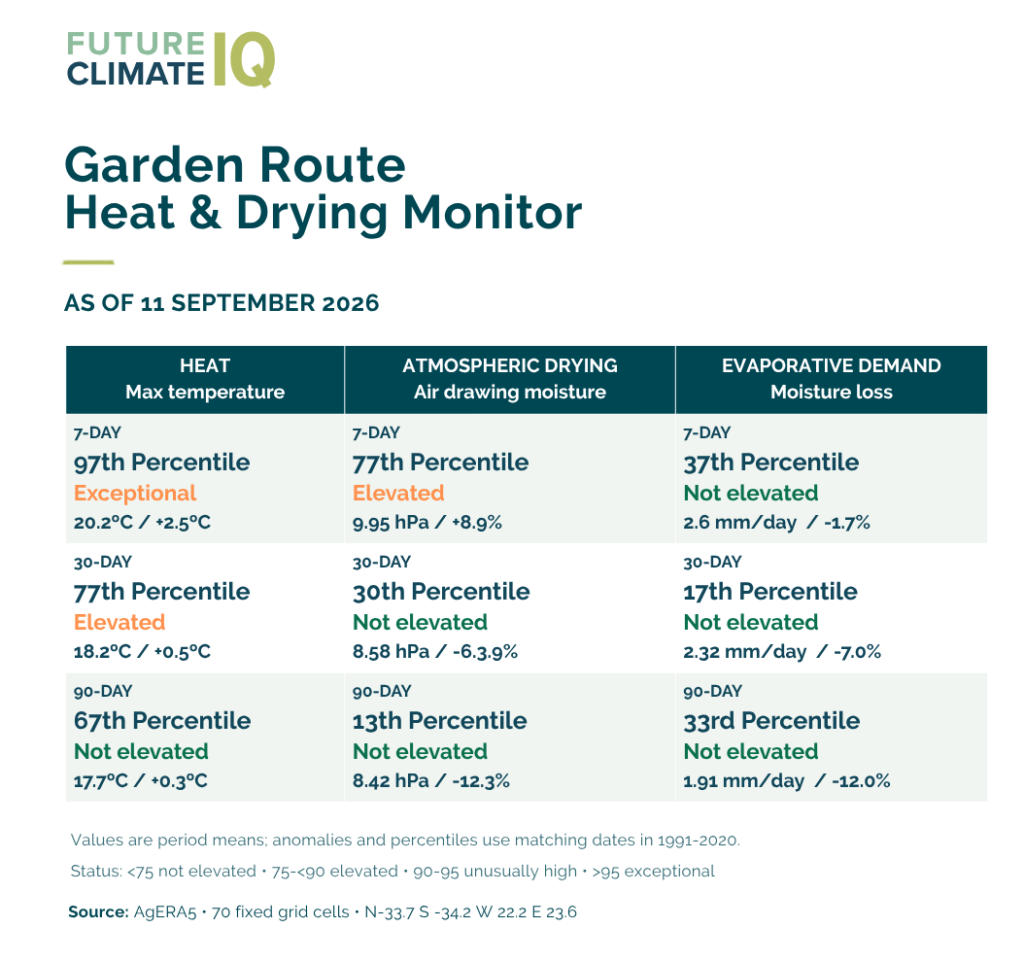
The interpretation of the above data is that recent heat has been exceptional vs the 1991-2020 average for the same period, but atmospheric drying and evaporative demand remain below normal over the longer 30- and 90-day periods. There is therefore no evidence at the moment of sustained atmospheric drying across the region.
Current assessment
There is currently no evidence that the forecast summer dry risk is translating into sustained drought or water stress across the Garden Route as of September 2026.
Rainfall accumulation, soil moisture and regional water storage remain favourable. Short-term heat has increased, but sustained atmospheric drying has not yet emerged.
The main concern remains the forward risk rather than any current impacts.
Forward risk
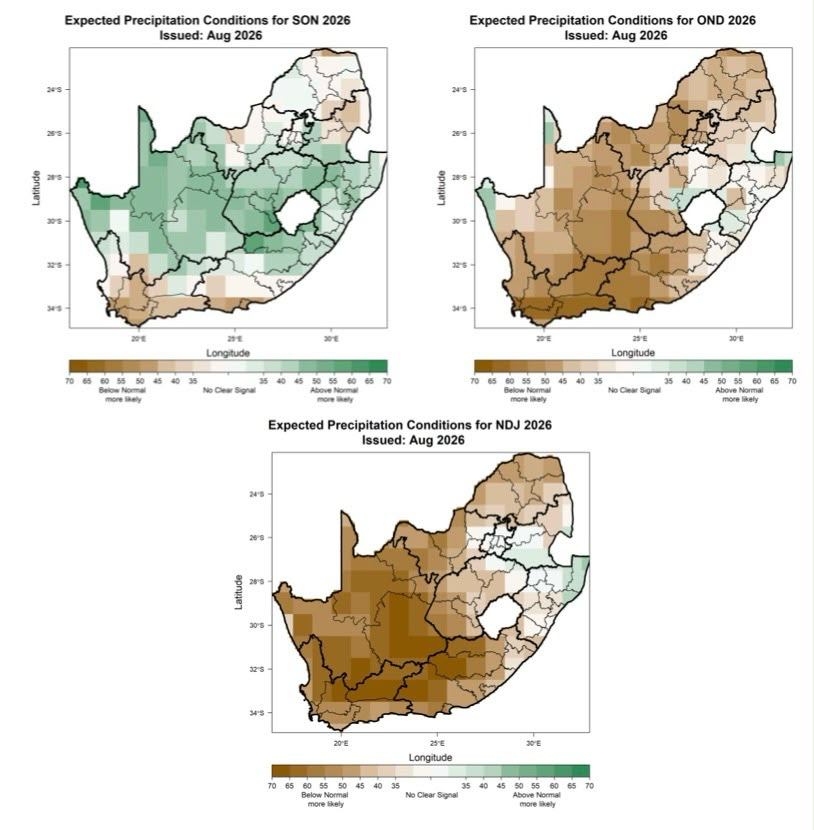
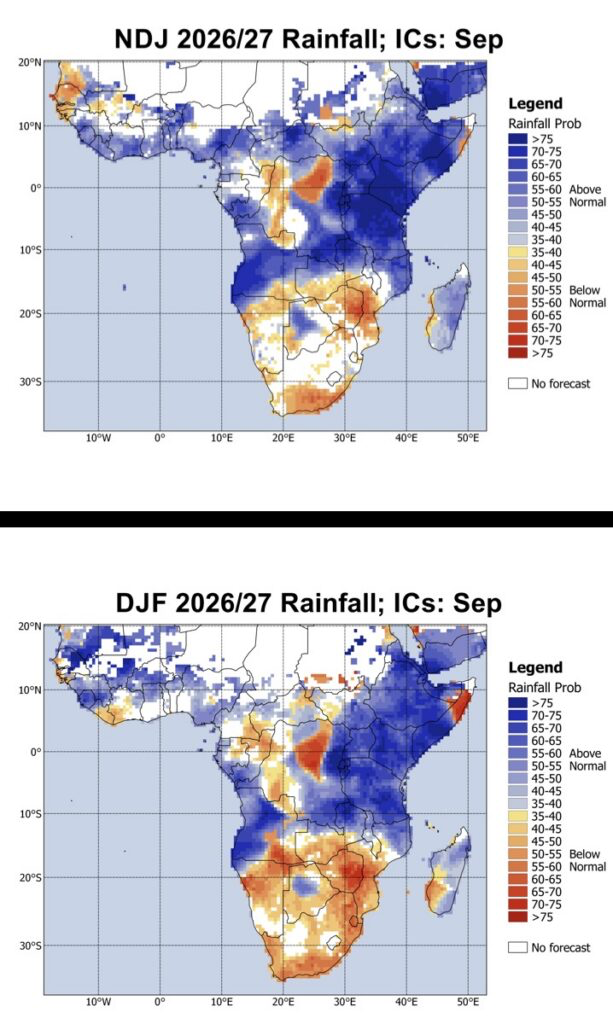
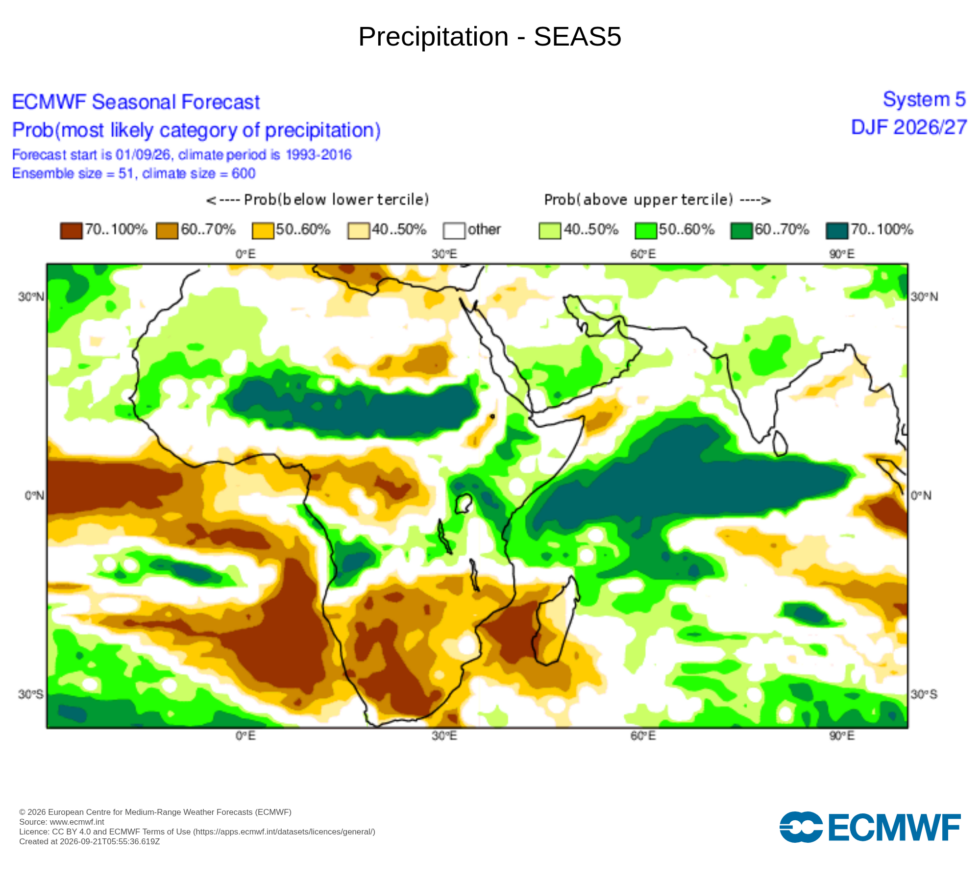
The September seasonal outlooks continue to show broad agreement, reinforced by the latest SAWS assessment released on 21 September: the probability of below-normal rainfall increases towards mid-summer, while above-normal temperatures are strongly favoured.
The Garden Route lies near the southern coastal edge of this broader dry signal, where confidence is a little lower than over the interior, but there is currently no meaningful competing wet-season signal. Above-normal temperatures are also strongly favoured across South Africa including the Garden Route region.
This assessment draws on seasonal outlooks from SAWS, the University of Pretoria, ECMWF and IRI.
From the South African Weather Service
From the University of Pretoria
From ECMWF
From IRI
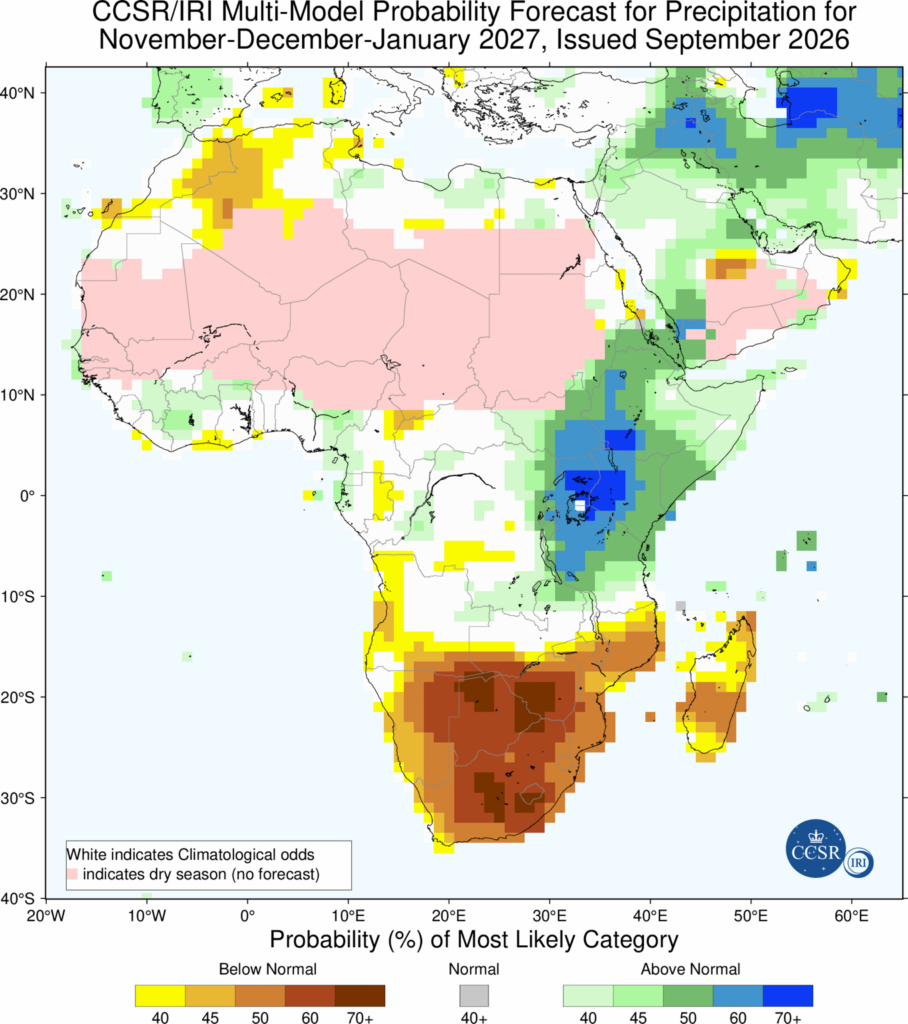
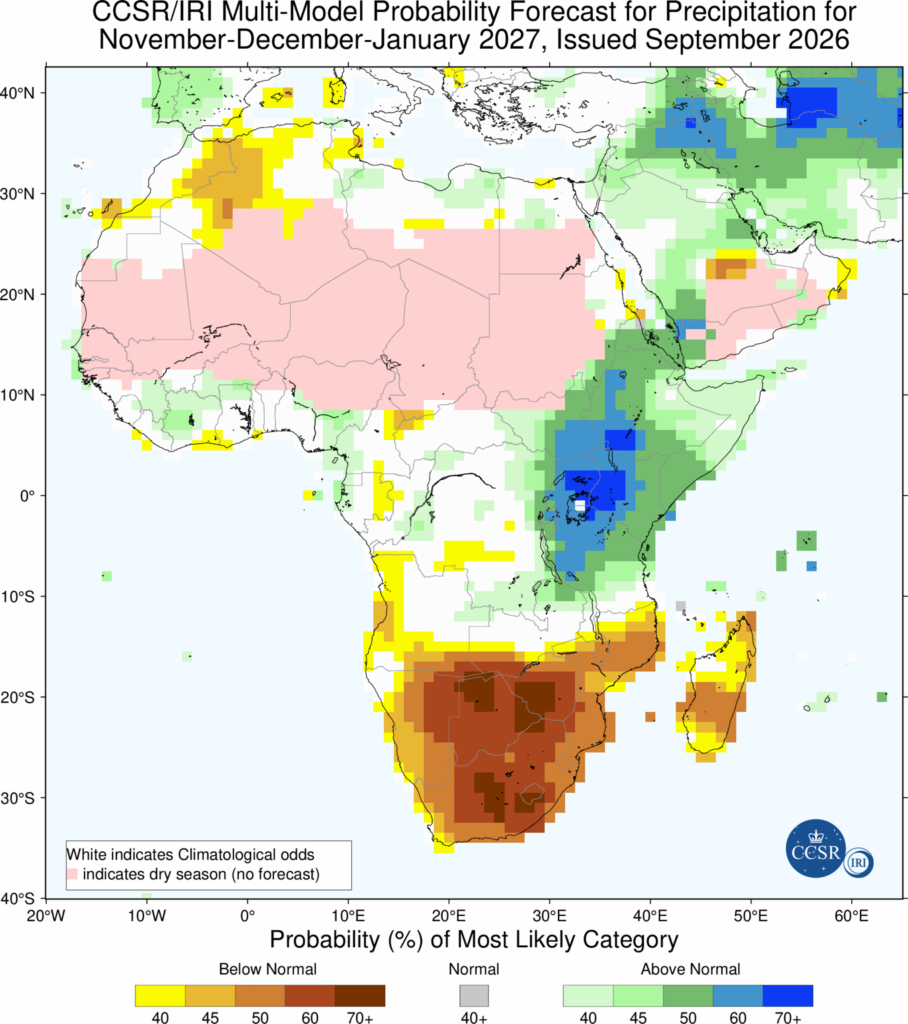
Taken together, these outlooks show broad convergence towards an elevated risk of below-normal rainfall during summer, alongside a strong above-normal temperature signal.
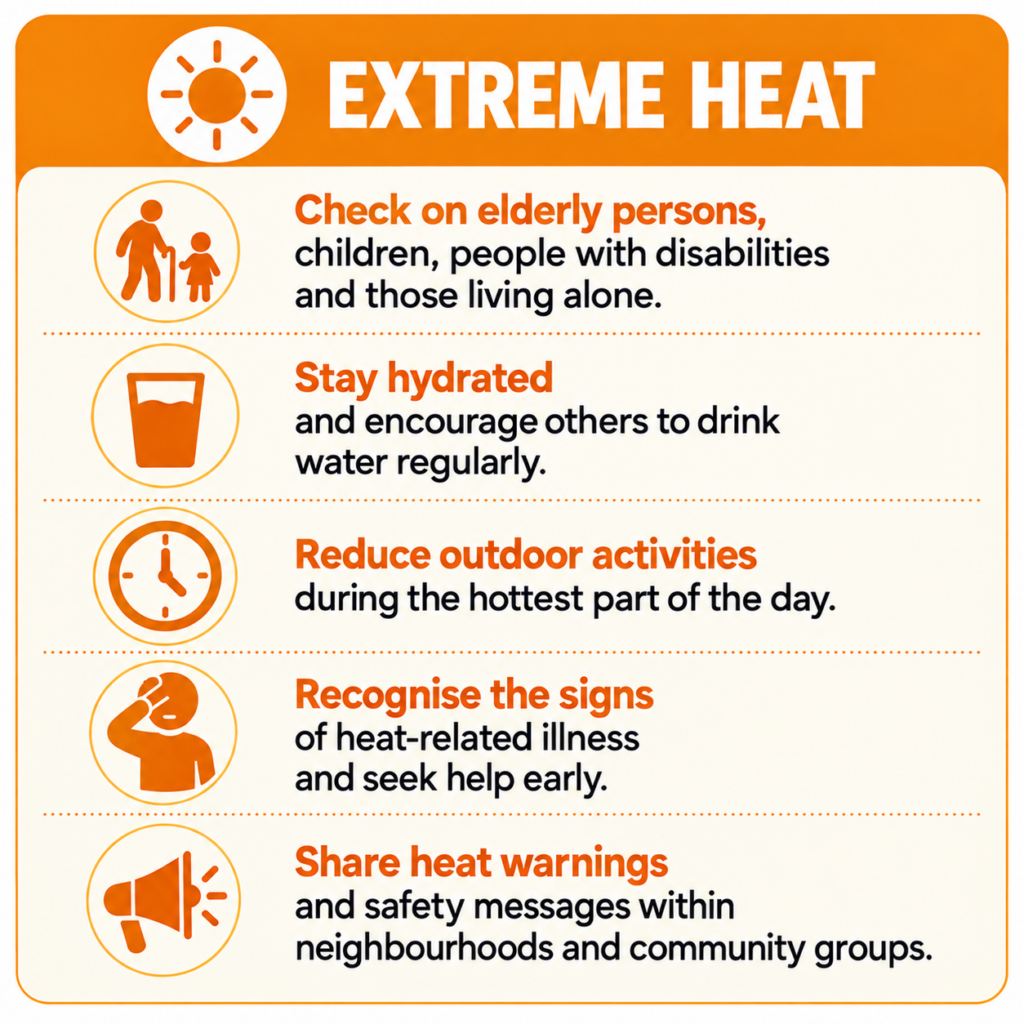
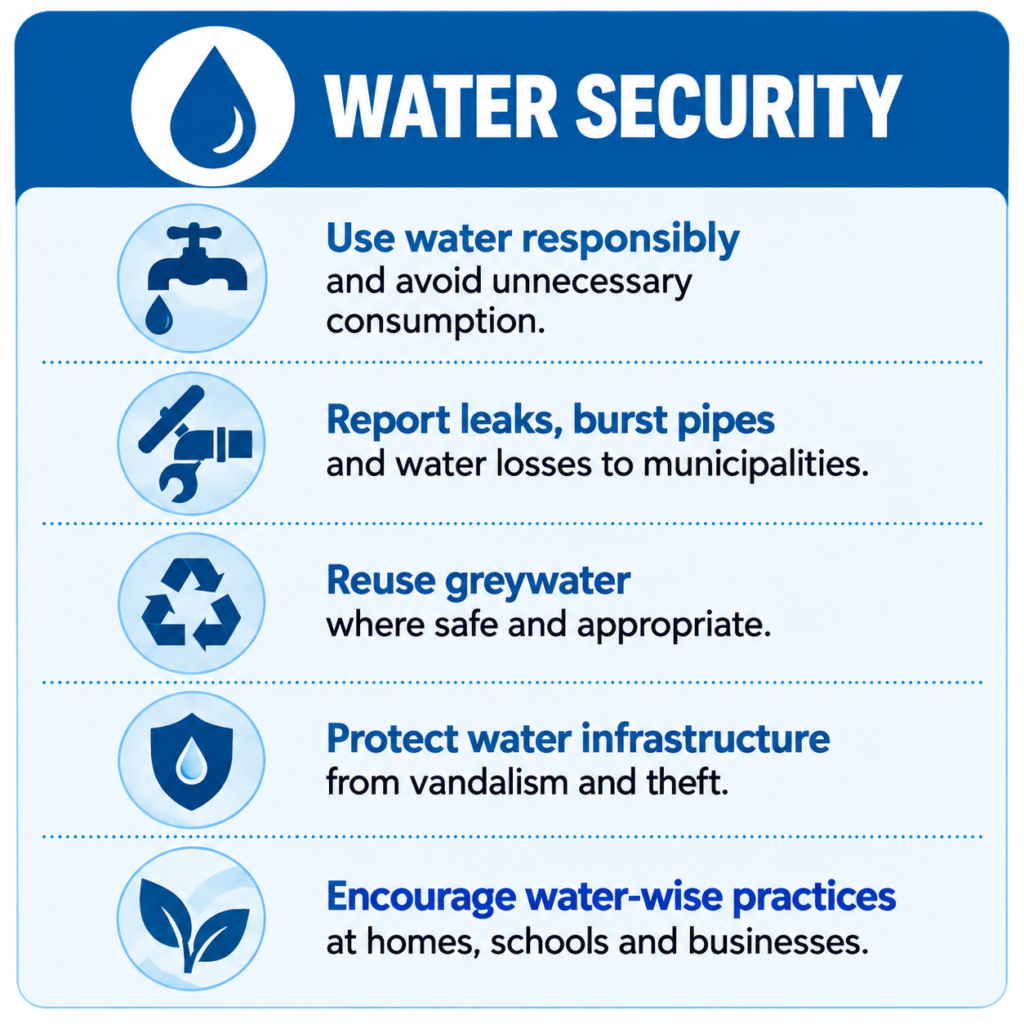
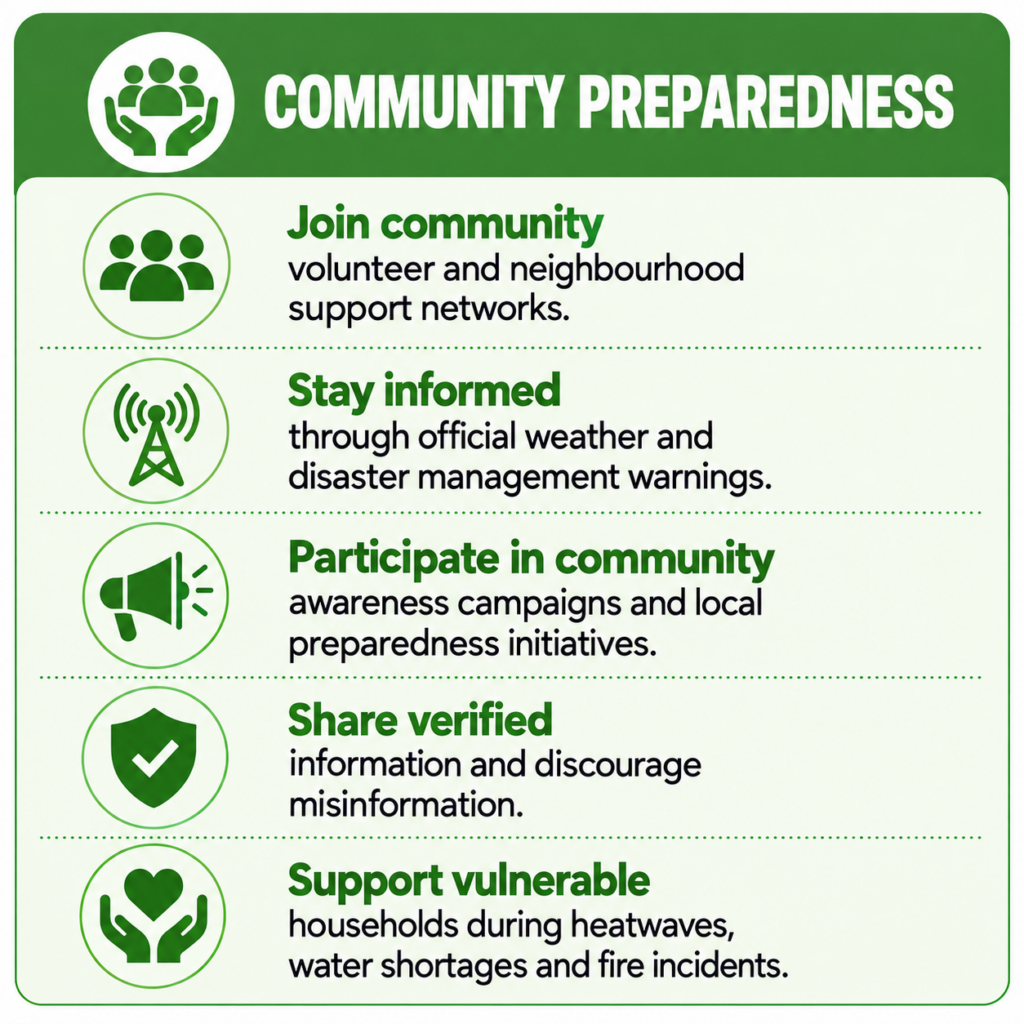
Each area of the Garden Route has its own specific challenges, but broadly speaking here are some no-regret preparedness actions that can be taken by communities in the area (as supplied by the Western Cape Government.)